


Regional Australia is a term coined by the Australian government to describe areas of Australia outside of the big four cities (well not quite this definition, but it's close enough). Successful, modern cities such as Sydney, Melbourne, Brisbane and Perth are magnets for productive, educated labour from all over the world. The magnetic appeal of Regional Australia to skilled labour is, in contrast, limited. In order to satisfy labour requirements, the Australian government entices suitably skilled labour to Regional Australia through fast-track visas and other incentives. The 2011 Australian census presents an opportunity to partition data by geographical area and therefore allow us to perform a comparison between Regional Australia and its state capitals.
I recently posted about income distribution across Australian states, which included income equality analysis based on standard deviation measurements. The logic behind this approach is that a wider spread of incomes indicates a higher degree of income inequality. The chart below shows relative standard deviation, i.e. the spread of incomes relative to the mean value. This relative figure solves the problem where a lower average income compresses the spread, making lower income regions appear more equal.
As can be seen above, regional Western Australia appears to have the highest degree of income inequality in the country, when measured by relative standard deviation. It even surpasses Northern Territory, the state/territory with the highest level of inequality covered in my previous post. The Western Australia section below covers the issue of regional WA income inequality in more detail..
The mean Sydney weekly income is $1,556 per week, equivalent to $81,203 per year, whereas regional NSW residents earn a mean $1,051 each week ($54,829 per annum), which is equivalent to 48% less than in the city.
What we see in Queensland is that the Brisbane is significantly wealthier than regional Queensland, and the Gold Coast sits somewhere in between the two. When measured by relative standard deviation, regional Queensland has higher levels of income inequality than the cities of South-East Queensland.
The Gold Coast and Brisbane have a fairly similar profile, and this may be expected given that the two cities are within commuting distance and therefore share significant portions of their economies with each other. There are two key differentiators between the two cities however. The Gold Coast has a bimodal profile in that there are spikes around both the $1,000 and the $1,400 per week bracket. Brisbane follows a more typical profile of having a single peak around $1,400 per week. The second key difference is that there are far more high earners in Brisbane than in the Gold Coast. For example, only around 0.5% of Gold Coast residents indicated that their household earned $2,300 per week ($120,000 per year). Of the Brisbane-based respondents, approximately 2.3% indicated that they earned this amount i.e. 4-5 times the frequency.
Melbourne-based residents earn significantly more than those in the regional areas. For example, only 6% of Melbourne households earn $900 per week and the most frequent income bracket is $1,400 per week.
Victoria is the only state in Australia where its capital has higher inequality than its regions. This can perhaps be attributed to a lack of mining activity in the state relative to other states.
Two characteristics stand out for regional Western Australia. One is the quantity of households earning no income each week, and the other is the significant spike at the $2,800 per week mark ($146,000 per year). Over 2% of regional Western Australian households report no weekly income. This is approximately double the rate seen in other areas measured here and many times the frequency seen in Perth.
At the other end of the income spectrum, almost 3.5% of regional Western Australians report an annual household income of over $146,000 each year. Of the areas measured here, only Sydney-based residents come remotely close to this, with around 2% reporting incomes at this level.
Regional Western Australia has the highest income inequality in Australia, when measured by relative standard deviation. Its relative standard deviation of 53% is thanks to a standard deviation of $690, and a mean income of $1,305. In comparison, the Northern Territory's relative figure is 47%, Perth and Brisbane's is 39% and the figure for the Australian Capital Territory is 34%.
I recently posted about income distribution across Australian states, which included income equality analysis based on standard deviation measurements. The logic behind this approach is that a wider spread of incomes indicates a higher degree of income inequality. The chart below shows relative standard deviation, i.e. the spread of incomes relative to the mean value. This relative figure solves the problem where a lower average income compresses the spread, making lower income regions appear more equal.
 |
| Relative standard deviation i.e. the spread of incomes relative to the mean income. This is an indicator of income inequality where the larger the percentage, the greater the inequality. |
As can be seen above, regional Western Australia appears to have the highest degree of income inequality in the country, when measured by relative standard deviation. It even surpasses Northern Territory, the state/territory with the highest level of inequality covered in my previous post. The Western Australia section below covers the issue of regional WA income inequality in more detail..
New South Wales
Australia's most populous state exhibits a stark contrast between Sydney and the rest of the state. Household income in regional New South Wales rises sharply to form a tall spike with a mode around $900 per week, then tapers away to almost zero by the $2,200 point. Sydney forms an entirely different income profile, with a more even spread across a range of income levels, with the most common income bracket being $1,300 per week.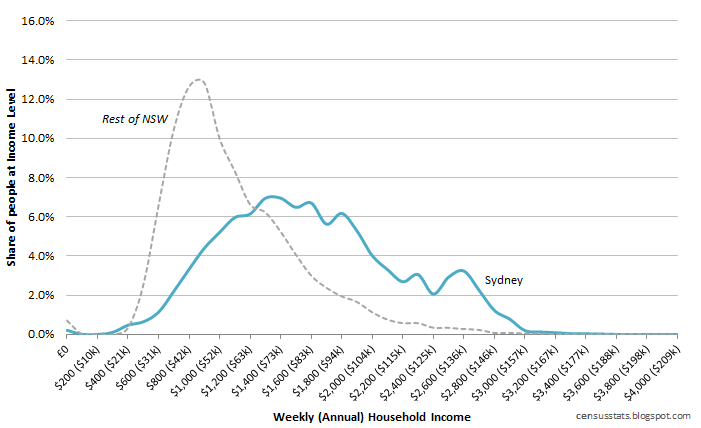 |
| Income distribution in Sydney vs the rest of New South Wales |
The mean Sydney weekly income is $1,556 per week, equivalent to $81,203 per year, whereas regional NSW residents earn a mean $1,051 each week ($54,829 per annum), which is equivalent to 48% less than in the city.
Queensland
Queensland is unique among Australian states in that its state capital, Brisbane, does not dominate quite to the same extent as capitals in other states. The second city in Queensland, Gold Coast, also doubles as Australia's fifth largest city, albeit one that is slowly merging with the capital over time. The Gold Coast is not classified as Regional Australia and if it was measured simply as 'non-Brisbane Queensland' then it could skew the results for regional Queensland significantly. It is for these reasons that both Brisbane and the Gold Coast are separately assessed for Queensland. |
| Income distribution in Brisbane vs the Gold Coast vs the rest of New South Wales |
What we see in Queensland is that the Brisbane is significantly wealthier than regional Queensland, and the Gold Coast sits somewhere in between the two. When measured by relative standard deviation, regional Queensland has higher levels of income inequality than the cities of South-East Queensland.
The Gold Coast and Brisbane have a fairly similar profile, and this may be expected given that the two cities are within commuting distance and therefore share significant portions of their economies with each other. There are two key differentiators between the two cities however. The Gold Coast has a bimodal profile in that there are spikes around both the $1,000 and the $1,400 per week bracket. Brisbane follows a more typical profile of having a single peak around $1,400 per week. The second key difference is that there are far more high earners in Brisbane than in the Gold Coast. For example, only around 0.5% of Gold Coast residents indicated that their household earned $2,300 per week ($120,000 per year). Of the Brisbane-based respondents, approximately 2.3% indicated that they earned this amount i.e. 4-5 times the frequency.
Victoria
Regional Victoria stands out as having the most extreme spike around a single income bracket. Around 16% of regional Victorians - around 1 in 6 - indicated a household income of $900 per week. This can be interpreted as indicating a high degree of income equality. Regional Victoria ranks third lowest in terms of relative standard deviation, further supporting its claims to higher income equality.Melbourne-based residents earn significantly more than those in the regional areas. For example, only 6% of Melbourne households earn $900 per week and the most frequent income bracket is $1,400 per week.
 |
| Income distribution in Melbourne vs the rest of Victoria |
Victoria is the only state in Australia where its capital has higher inequality than its regions. This can perhaps be attributed to a lack of mining activity in the state relative to other states.
Western Australia
Western Australia - the primary recipient of mining boom economic effects - appears to have the closest correlation between its capital, Perth, and the rest of the state. With a mean household income of $1,520, Perth households earn approximately $200 more than their regional counterparts. As a key base for FIFO mine workers, and the location of many mining offices, Perth is a city that is reaping the benefits of the growth in the resource sector. |
| Income distribution in Perth vs the rest of Western Australia |
At the other end of the income spectrum, almost 3.5% of regional Western Australians report an annual household income of over $146,000 each year. Of the areas measured here, only Sydney-based residents come remotely close to this, with around 2% reporting incomes at this level.
Regional Western Australia has the highest income inequality in Australia, when measured by relative standard deviation. Its relative standard deviation of 53% is thanks to a standard deviation of $690, and a mean income of $1,305. In comparison, the Northern Territory's relative figure is 47%, Perth and Brisbane's is 39% and the figure for the Australian Capital Territory is 34%.


1 comments:
We give out all kind of loan like Business loan, home loan, Agricultural loan, Personal loan, auto loan and other good Reason. We have built up an excellent reputation over the years in providing various types of loans to thousands of our customers. We Offer guaranteed loan services with either a good or bad credit history.
We also give out loans from the rang of $10,000 USD- $10,000,000.00 USD at a 1% interest rate.
Duration of 1- 25 years depending on the amount you need as loan.
Please contact us:
Call/ Text & Whatsapp: +1 878-225-9786
Email: (mrYoungLeroy@hotmail.com)
OR (youngloancompany.us@gmail.com)
Website: www.youngloancompany.weebly.com
Post a Comment