After 'no religion', all remaining significant responses are negative in real terms. The next ranked religion is Catholicism, with a -7% result in real terms. The non-adjusted figure for Catholicism sees a clear rise of 9% to bring the number of Catholics up by 437,643.
Of the significant 2001 responses, Catholicism represents the least bad result in 2011. The other popular Australian religions have even less responses, indicating a fundamental shift in religious demographics within the country. Eastern Orthodox dropped 9.1%, with the Protestant denominations of Anglican, Presbyterian and Uniting Church plummeting 19%, 19.6% and 27% respectively.
 |
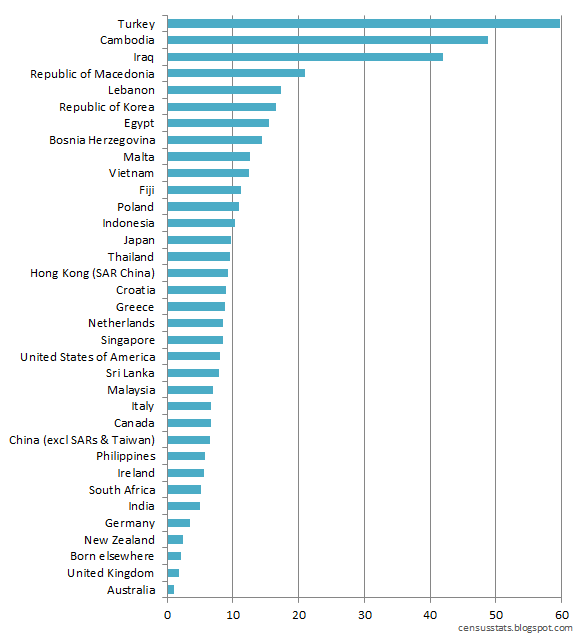
| Religious affiliations with largest percentage increase 2001-2011. Percentage figure is adjusted to remove impact of natural population growth (real change). |
In contrast to the consistently negative results for the larger Christian denominations, other religions face a generally positive picture. Hinduism, in particular, has seen a huge increase by 147% in ten years in real terms and a nominal increase by 189%. In absolute terms, Hinduism's growth is third only to Catholicism and Islam. This increase can be explained through a similarly huge increase in migration from India between 2001 and 2011, with a 209% increase in census respondents indicating they were born in India. India has provided by far the largest relative increase in migrants in the decade to 2011, which correlates closely to the parallel increase in Hinduism.
Both Islam and Buddhism have also shown substantial real increases, at 44.6% and 26.4% respectively. This indicates both religions, along with Hinduism, are playing a more significant role in Australian society than they have in the past. 2.2% of Australians follow the Muslim faith, and 1.3% follow Hinduism. For comparison, the UK's 2001 census showed their equivalent figures were 2.7% and 1% respectively.
 |
| Religious affiliations with largest percentage decrease 2001-2011. Percentage figure is adjusted to remove impact of natural population growth (real change).
|
Christian churches make up all of the bottom ten performers. The Churches of Christ had the largest contraction ratio over the decade to 2011, followed by the Protestant churches of the Salvation Army, Uniting Church, Presbyterian and Reformed, Anglican and Lutheran churches. The remainder of the bottom ten performing denominations are all Christian variants.
Religion in the 25-34 Age Range
The overriding theme of poor performing Christian denominations may somewhat mask the reality of the situation in Australia. It is apparent there is a significant reduction in affiliation throughout much of the Christian religion in Australia. However, in order to understand the future of the religion, it is important to understand adherence within younger demographic.
 |
| Absolute counts of responses, change between 2001 and 2011 Australian censuses. |
The 2011 census provides statistics broken down into age ranges, including the 25-34 range. This age range should be an effective indicator of future trends; these are prime working age respondents, often raising families and with limited influence from their own parents.
In the 25-34 range, Christianity performs even poorer than in broader ranges. An absolute reduction of 241,676 among this age range does not bode well for the future of the religion in Australia. In contrast, religions fuelled by immigration are showing significant increases, including Buddhism, Hinduism and Islam. This is also the prime age range for government-encouraged immigration, which further explains the positive results shown for these religions.
Together with Christianity and other religions, this leaves a net absolute reduction among this age range of 84,811. It should be noted that this net reduction is despite the population increasing by 246,687 in the 25-34 age range. This pattern of absolute reduction of Christian following in Australia is a trend that cannot be sustained if the religion is to avoid a slow, lingering death. Contraction among this age range is outpacing natural population growth and the generational effect may accelerate contraction further in future, as older followers die off and young parents choose not to associate their children with their Christian religion.
Atheism, Agnosticism and other Non-Religious Categories
Agnostics, atheists, humanists, rationalists and other non-religious respondents add up to an increase of 321,988 in the 25-34 age range, which amounts to more than double the increase from Buddhism, Hinduism and Islam combined.
 |
| Percentage increase in no religious affiliation responses by state (in real terms, i.e. adjusted for population growth) |
Australia as a whole shows a 41% increase in respondents indicating no religious affiliation. Western Australia, Victoria, New South Wales, and the combination of the Northern Territory, ACT and Tasmania all demonstrate similar levels of growth of atheism, agnosticism, humanism etc.
The two outliers are South Australia and Queensland. South Australia has seen limited growth in non-religious responses, at around 26% for all ages and a surprisingly low 15% growth among 25-34 year olds.
At the other end of the spectrum, Queensland has shown significant growth among the non-religious categories, at 56%, which far more than any other state.
State-by-State
The national average has Catholicism and other Christian churches as the most frequently chosen response at 25% and 36% respectively, bringing them up to a total of 61% combined. Beyond the Christian responses, 'no religion' comprised 22% and other responses comprised 17%.
 |
| Religious affiliation by state, 2011 Australian census data |
Victoria, Queensland and Western Australia were broadly in line with the national average; the only figure of note is that Queensland has slightly less non-religious respondents but more non-Catholic Christian respondents.
New South Wales' mix is significantly different from the national average, and any other state. The key differentiator is that the state is significantly more religious than any other state. With only 18% of respondents indicating atheism, humanism, agnosticism or rationalism, each of the other religious categories were slightly above average.
The Northern Territory has a significantly higher rate of 'other' religions. This can be partly explained by the far higher rate of indigenous residents in the state, at 27%.
A somewhat surprising figure is that 28% of respondents in South Australia indicated that they have no religious affiliation. This is significantly higher than any other large state and is in contrast with the state's conservative, religious reputation. When this high rate of non-religious affiliation is combined with the low growth of of non-religious affiliation in South Australia, a picture is painted of a state with a mature, stable non-religious culture.
Conclusion
The Christian denominations have demonstrated significant contraction over the decade to 2011. In particular the larger protestant denominations have demonstrated particularly disappointing results. The global behemoth of Catholicism is also struggling; growing in nominal terms but its influence is waning as its growth is not keeping up with natural population growth.
The other key global religions of Buddhism, Islam and Hinduism have seen significant growth in Australia and this impressive growth is assumed to be driven by Asian immigration.
Of course, the main story here is the growth of non-religious responses, which equates to the contraction of religion in Australia. This is a story portrayed emphatically in every state, multiple age ranges, and across all popular religious denominations. Philosophies such as atheism, agnosticism, humanism and rationalism are all clearly on the rise in Australia. Their influence has increased since 2001 and can be expected to continue to increase over the coming years.
| Most stats taken from ABS 2011 Australian Census data. |